The average tax refund for Lassen County residents exceeds $3,100
A new study from Upgraded Points has identified the U.S. locations with the largest average tax refunds.
As the April tax filing deadline approaches, millions of Americans are preparing their returns and anticipating potential refunds. For many, the federal tax refund represents an important financial boost — one that can help cover expenses, reduce debt, or increase savings.
Using the latest data from the Internal Revenue Service, Upgraded Points, a company that provides advice on credit card rewards programs and other financial products, explores how refund amounts have changed in recent years and how they vary across income levels and geographic areas. The report looks at national trends in average refund size, the share of taxpayers receiving refunds, and detailed breakdowns by income group, state, and county — offering a closer look at where refunds are highest and for whom.
How much do Americans receive in tax refunds?
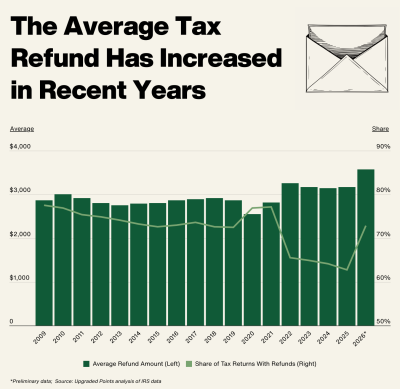
Over the past 15 years, the average federal tax refund has generally remained in the range of $2,800 to $3,000, but the COVID-19 pandemic disrupted that pattern. During the 2020 filing season, the average refund dropped to $2,549, reflecting widespread job losses and reduced earnings early in the crisis.
In the years that followed, refunds rebounded sharply. A combination of rising wages, expanded tax credits, and other stimulus measures pushed the average refund to a record $3,252 by 2022. Yet, as pandemic-era tax credits expired, a smaller share of taxpayers ended up receiving refunds. The proportion of returns resulting in a refund dropped from 77.1% in 2021 to just 62.8 percent by 2025. However, preliminary data for the 2026 tax season currently reports a higher average refund of $3,571 and a 72.9 percent refund rate, though early filing trends typically skew these figures upward.
Average tax refund by income group
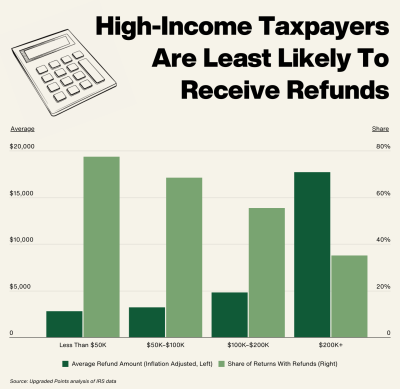
Tax refunds vary significantly by income level, with higher-income households receiving larger refunds on average but a smaller share of these households receiving refunds at all. According to the latest IRS data, filers earning less than $50,000 received an average refund of $2,766 after adjusting for inflation, with over 77 percent of total returns in this group receiving refunds. Refund participation was nearly universal among the lowest-income group, with 99.3 percent of those eligible choosing to receive a refund rather than applying their overpayment to next year’s taxes.
For middle-income filers earning $50,000 to $100,000, the average refund rose to $3,211, though just 68.3 percent received one. Refunds increased further to $4,820 for those earning $100,000 to $200,000, but only 55.4 percent of these returns resulted in a refund.
At incomes above $200,000, the average refund surged to $17,668. Yet just 35 percent of returns received a refund, and nearly one-third of filers with overpayments opted to apply their credit to the following year’s taxes instead.
States with the largest tax refunds
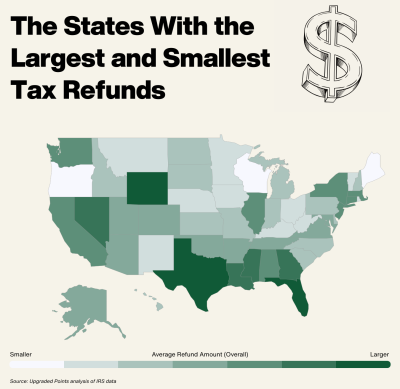
Average federal tax refunds vary widely across states, with a clear concentration of higher refunds in parts of the South and Mountain West. Below are the 5 states with the highest average refunds, based on the latest IRS data:
- Florida
Florida reported the highest average refund in the country at $4,433 after adjusting for inflation. Out of more than 11.1 million federal tax returns filed, about 7.5 million (67.1%) resulted in a refund. - Texas
In Texas, the average refund stood at $4,344, slightly below Florida. The state had the second-largest overall filing volume of any state, with 13.6 million returns filed and over 9.7 million (71.3 percent) receiving a refund. - Wyoming
Despite its smaller population, Wyoming recorded an average refund of $4,282. Of the 280,750 returns filed, about 190,000 (67.8 percent) received a refund. - Nevada
Nevada had an average refund of $4,193, with 1.08 million refunds issued out of 1.6 million total returns — an overall refund rate of roughly 69.6 percent. - Louisiana
Rounding out the top 5, Louisiana reported an average refund of $4,117, with 1.4 million refunds issued across nearly 2 million returns, reflecting a 73.0 percent refund rate — the third-highest of all states.
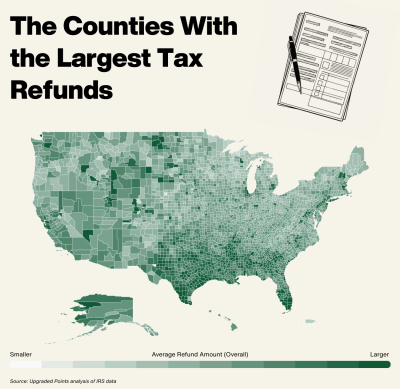
Counties with the largest tax refunds
At the local level, some of the highest average tax refunds in the country are concentrated in counties with especially high incomes. Each of the 5 counties listed below falls within the top 5 percent of the U.S. income distribution, and all are known for their concentrations of wealth and high-value property. These counties also tend to have lower rates of refund issuance overall, reflecting more complex tax situations and a greater likelihood of filers applying overpayments to future tax years.
- Teton County, Wyoming
Located in northwestern Wyoming and home to the town of Jackson, Teton County had the highest average refund in the nation at $15,156. Of the 15,210 federal tax returns filed, only about 7,900 (51.9 percent) resulted in a refund — well below the national average. - Pitkin County, Colorado
Home to the resort town of Aspen, Pitkin County recorded an average refund of $8,756. Roughly 5,470 of the county’s 10,520 filers received a refund, a 52.0 percent refund rate similar to Teton County. - Summit County, Utah
Nestled in the Wasatch Range and encompassing Park City, Summit County had an average refund of $8,481. Out of nearly 25,000 returns filed, 13,940 (55.8 percent) received a refund. - Collier County, Florida
Located on Florida’s Gulf Coast and including the city of Naples, Collier County reported an average refund of $7,674. Of the 214,600 tax returns filed, roughly 121,400 (56.6 percent) resulted in a refund. - Shackelford County, Texas
Though much smaller in size, Shackelford County — a rural area north of Abilene — had an average refund of $7,375. Just 940 of its 1,490 returns (63.1 percent) received a refund, suggesting a smaller but relatively affluent taxpayer base.
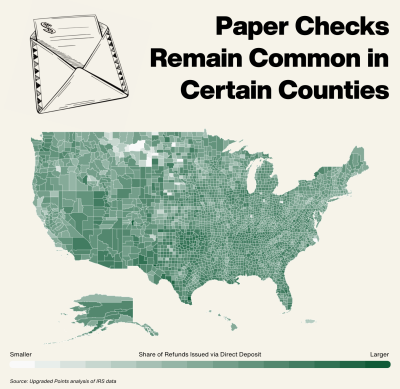
Where Americans still rely on paper checks for refunds
While just over 90 percent of Americans received their tax refunds via direct deposit in the most recent full year of IRS data, around 10 percent of taxpayers still opted to receive paper checks. This nationwide figure, however, masks substantial regional variation.
Across most states, direct deposit is the clear norm, with particularly high adoption rates in the South and West. However, in several New England and Midwestern states, the use of traditional paper checks remains comparatively higher. County-level data show even more pronounced disparities, especially in rural areas.
In parts of Montana and the Dakotas, for example, fewer than 70 percent of refunds are issued via direct deposit, suggesting continued reliance on paper checks in remote and low-population areas. These counties also tend to have older average populations, a demographic more likely to use brick-and-mortar banks and less likely to adopt newer technologies.
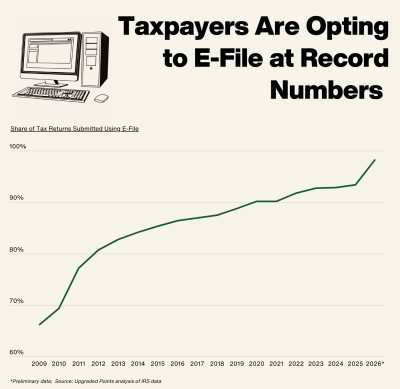
How do Americans prefer to file their tax returns?
Just as direct deposit has largely replaced paper checks, the way Americans submit their tax returns has undergone a dramatic transformation. In 2009, 66.1 percent of all tax returns were submitted using e-file. As consumer tax preparation software became more accessible and the IRS expanded its digital infrastructure, that share steadily climbed, surpassing 80 percent by 2012 and continuing a gradual upward trajectory throughout the decade.
Much like its impact on refund sizes, the COVID-19 pandemic served as a major catalyst for further digital adoption, pushing the share of e-filed returns past the 90 percent threshold for the first time during the 2020 filing season. Today, electronic filing is nearly universal. For the 2026 filing season, preliminary data indicates that an unprecedented 98.3 percent of tax returns will be submitted via e-file, aligning with the overwhelming preference for direct deposit to process returns quickly and securely.
Here is a summary of the data for Lassen County
• Average refund amount (overall): $3,148.
• Average refund amount (<$50k): $2,617.
• Average refund amount ($50$–$100k): $3,067.
• Average refund amount ($100k–$200k): $4,984.
• Average refund amount ($200k+): $7,429.
• Share of returns with refunds: 67.5 percent.
• Share of refunds issued via direct deposit: 86.6 percent.
Methodology
This analysis uses data from two primary sources provided by the Internal Revenue Service: the Filing Season Statistics and the Individual Income Tax Return (Form 1040) Statistics.
The Filing Season Statistics offer the most up-to-date information on federal tax refunds, including estimates through the 2026 filing season. However, these figures reflect data by filing season, not by tax year, and may differ slightly from specific tax year data.
For more detailed breakdowns (such as refund amounts by income level, state, and county), the most recent available data from the Form 1040 Statistics, which covers Tax Year 2022, was used.
The average refund amount was calculated by dividing the total amount of overpayments refunded by the total number of returns that resulted in a refund, which is consistent with the IRS’s standard definition. Dollar values were adjusted for inflation to better estimate tax refunds in 2026.
It is important to note that this does not represent the average total overpayment since some taxpayers elect to have their overpayments credited to the next tax year rather than refunded. However, according to IRS data, approximately 97 percent of taxpayers choose to receive their overpayment as a refund, making this a reliable estimate of the refund experience for most filers.
About Upgraded Points
Upgraded Points’ travel and financial expertise and insights are regularly featured across top-tier publications such as The New York Times, Forbes, Travel & Leisure, Business Insider, Fox Business, Washington Post, CNBC, TimeOut, and many more.